GILI Sports, a retailer of paddle boards, gear, and outdoor water sports accessories, wanted to improve their online store’s conversion rates and increase revenue without proportionally increasing acquisition spend. DevVerx stepped in to audit their Shopify store, implement CRO tactics (improving UX, product pages, checkout flow, trust signals), and run tests. The result was a measurable uplift in conversions, reduced cart abandonment, and better customer trust and satisfaction.
Case Study
Introduction
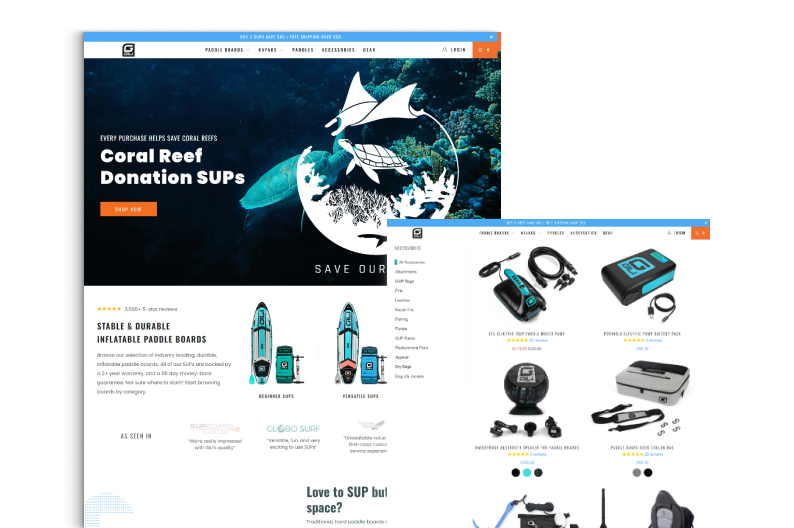
GILI Sports is a brand offering stand up paddle boards (SUPs), kayaks, and related outdoor gear. Their mission includes not just selling high-quality products but also giving back to ocean conservation. Their Shopify store is their main channel for sales globally. DevVerx was engaged to improve the store’s effectiveness — not by redesigning everything, but by optimizing key touchpoints in the conversion funnel: product discovery, product pages, checkout, and trust-building — to maximize revenue and improve user experience.
Project Name / Code:
CRO Optimization – GILSports
Category:
Retail / Outdoor Gear / Sporting Goods
Technology:
Shopify , Payment Gateway , VW0 , Google Search Console
Location
United States
Project start date
2024
Project Name / Code:
CRO Optimization – GILSports
Category:
Retail / Outdoor Gear / Sporting Goods
Technology:
Shopify , Payment Gateway , VW0 , Google Search Console
Location:
United States
Project Start Date:
2024
About
Problem Statement
Although traffic and product quality were strong, GILI Sports had lower-than-desired conversion rates. Key problems included:
Product pages with high bounce rates: product images/descriptions were not always persuasive or clear.
Friction in the checkout process, perhaps too many steps or distractions that caused cart abandonment.
Lack of visible trust signals (guarantees, reviews, security cues) to reassure hesitant customers.
Slow or suboptimal mobile experience, which is critical since many customers browse and buy from mobile devices.
Underutilization of psychological triggers (urgency, scarcity, social proof) that can nudge a visitor toward purchase.
Objectives
Increase overall conversion rate (from visitor to buyer) by a meaningful percentage (e.g. 20–40%).
Reduce cart abandonment rate.
Improve average order value (upsells, cross-sells).
Enhance user trust and reduce hesitation in purchase.
Ensure scalability and seamless integration using modern technologies.
Provide a structure for ongoing testing and optimization.
Implementation
Below are the approaches DevVerx used to address the problems and reach the objectives: