This project involved designing and delivering an interactive, high-impact annual report website for NAPA (National [or relevant] Association). The objective was to present their yearly achievements, financials, initiatives, and impact in a compelling, user-friendly format. Through clear storytelling, intuitive navigation, and visually engaging layouts, the report amplifies stakeholder engagement and reinforces transparency.
Case Study
Introduction
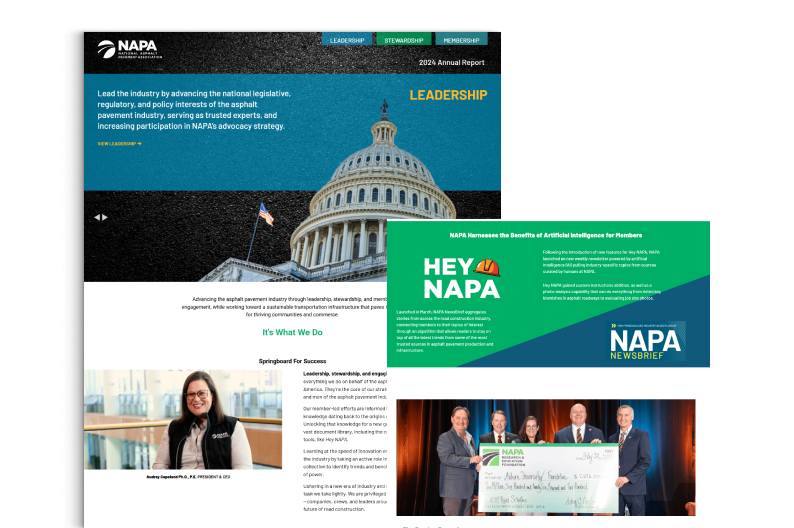
The NAPA Annual Report website serves as the digital representation of the organization’s yearly performance, covering goals met, projects launched, financials, and impact stories. Its audience includes members, donors, partners, regulators, and the public. Before this engagement, NAPA’s reports were delivered via static PDFs or print, limiting user engagement and analytics insight. The new web platform brings the annual report to life through interactivity, responsive design, and multimedia integration.
Project Name / Code:
NAPA Report Platform (NRP)
Category:
Publishing / Nonprofit / Reporting
Technology:
WordPress , Javascript , Elementor , Php
Location
United States
Project start date
2024
Project Name / Code:
NAPA Report Platform (NRP)
Category:
Publishing / Nonprofit / Reporting
Technology:
WordPress , Javascript , Elementor , Php
Location:
United States
Project Start Date:
2024
About
Problem Statement
Traditional annual reports often suffer from low engagement, limited accessibility, and static formats. For NAPA:
Stakeholders found PDF reports less accessible on mobile or low bandwidth.
Tracking engagement (which sections were viewed, how long users stayed) was difficult.
The narrative and visuals were less interactive and harder to update after launch.
Integration of media (charts, videos, images) was constrained in print/PDF.
To address these issues, a dynamic web version of the annual report was needed—one that combines storytelling, data visualization, and analytics in an accessible, responsive package.
Objectives
Create a web-based annual report that is responsive, engaging, and accessible.
Use interactive visuals (charts, graphs, infographics) to present data more clearly.
Embed multimedia (photos, videos, testimonials) to bring impact stories alive.
Enable analytics and tracking to measure user engagement per section.
Ensure the site is performant, secure, and easy to maintain or update.
Implementation
The project was implemented as a web presentation site with modular content:
Hosting & Infrastructure:
Hosted on a scalable web hosting or CMS platform with SSL and performance optimizations.
Database / Storage:
If CMS-based: content stored in database (e.g. WordPress, Drupal, or headless CMS).
Media assets (images, video) stored in media storage / object storage, delivered through CDN.
Frontend / UI:
Design of a custom theme focused on readability, visual hierarchy, and storytelling flow.
Responsive layouts for desktop, tablet, and mobile.
Use of JavaScript libraries / frameworks for interactive charts (e.g. D3.js, Chart.js) and animations.
Backend / APIs / Integration:
Content management via a CMS or custom admin interface for editing report sections.
APIs or data endpoints to supply chart data dynamically from spreadsheets or databases.
Integration with analytics (Google Analytics, custom tracking) to monitor user flows.
Possible versioning or archiving logic to publish successive yearly reports.
Key Takeaways / Challenges:
Balancing rich interactivity with performance (especially for mobile users).
Ensuring accessibility (screen readers, alt texts, color contrast) when visualizing complex data.
Structuring content and navigation to guide the user through narrative flow (overview → financials → stories → future outlook).
Providing authors (non-technical users) an easy interface to update content after launch.
Results / Outcomes
KPIs / Metrics:
Higher engagement time per user compared to PDF reports.
Increased number of sections viewed per visit.
More shares / referrals of report pages.
Better feedback from stakeholders on report clarity and experience.
Before & After Comparison:
Before: Static PDF / print reports, limited interactivity, difficult mobile reading, poor analytics.
After: Dynamic web report with visual storytelling, analytics, multimedia, and responsive design.
Key Improvements:
Enhanced readability and engagement through interactivity.
Ability to track user behavior and measure impact of different report sections.
Stronger perception of transparency and professionalism.
Easier future updates or additions (e.g. last-minute corrections, new media) without reprinting.
Technologies
Technologies / Tools that We used to achieve this task